
Let me see your sources
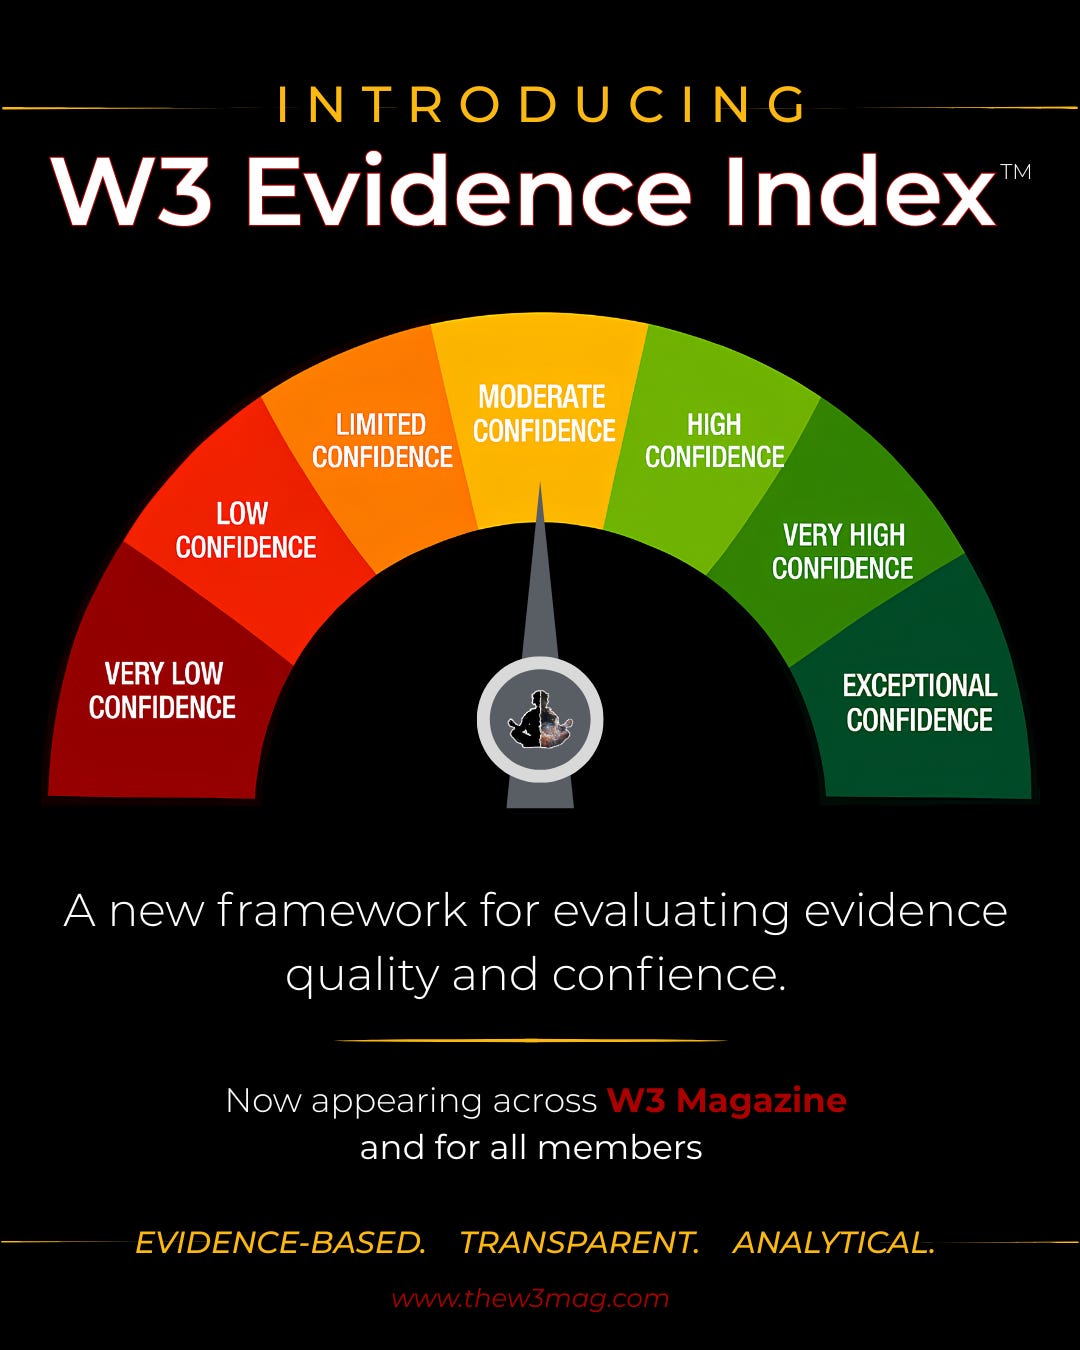
A new way to measure confidence in the sources we use, and what paid members will see that no one else does.

A study gets cited. A survey gets shared. A government report gets linked in a thread that goes nowhere good. Every argument in the modern information ecosystem now arrives wearing a source like a badge of legitimacy. The badge is rarely checked.
That is the gap the W3 Evidence Index™ was built to close.
The Central Argument
The existence of a source does not make a claim strong. A citation tells a reader where information came from. It does not tell them how much weight that information can actually carry. W3 Magazine built the Evidence Index™ to answer the second, harder question: how much confidence should a reasonable reader place in this source, for this specific claim?
Context
Public discourse has a credibility problem that has nothing to do with whether sources exist and everything to do with whether anyone is asked to evaluate them. A claim described as “backed by research” might rest on a rigorous longitudinal study or a single self-selected online poll. Both get called research. Few readers are given the tools to tell the difference in the moment that matters, which is before they accept the claim.
The Evidence Index™ is not peer review, legal analysis, or intelligence assessment, and it does not pretend to be. It is an editorial tool, built for readers who want a fast, honest signal about the evidentiary ground a piece of analysis is standing on.
The Common Misunderstanding
The instinct is to treat sources as binary: credible or not, trustworthy or biased, scientific or anecdotal. That instinct fails in practice, because credibility is not a fixed property of a source. It is a property of the match between a source and the claim it is being asked to support.
A national polling organization can be highly credible for describing public opinion and far less useful for proving why that opinion formed. A vendor-funded industry report can flag a real emerging risk and still deserve a discounted score because its funding creates an incentive to overstate the threat. Formality is not the same as rigor, and informality is not the same as unreliability. The Evidence Index™ exists to make that distinction visible instead of assumed.
How the Evidence Index™ Works
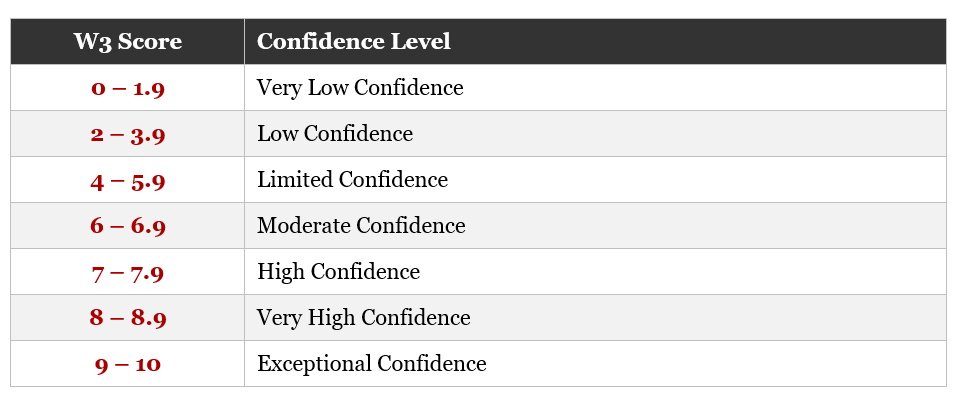
Every rated source receives a score from 0 to 10, mapped to a confidence level on the scale below. The scale is intentionally simple. A reader should be able to glance at a score and immediately understand roughly how much weight the underlying source can bear.
Behind every score sits the same set of questions. How sound is the methodology? How strong and representative is the underlying data? How transparent is the reporting? How well does the finding hold up against other credible evidence? Is there a financial or institutional interest that should discount confidence in the conclusion? None of these questions reward a source for sounding formal, and none of them punish a source for being informal. A government dataset and an investigative news story are evaluated against the same standard: does the evidence support what is being claimed on its behalf.
What Paid Members See
Every Evidence Index™ entry, for every reader, includes the source, the numerical score, and the confidence level. That much is visible to everyone.
Paid W3 subscribers see one additional layer: the full written assessment explaining why a source earned its score, what the rating does and does not establish, and where the evidentiary limits sit. This is the part of the model that does the actual teaching. The score tells a reader how much confidence to place in a source. The assessment tells them why, which is the part that builds judgment over time rather than just borrowing it for one article.
Below are three sample entries from a recent W3 source review, shown first as paid members will see them, then as free readers will see the same entries.
Member View — Full Evidence Review
Source: Pew Research Center, national survey on public trust in institutions
W3 Evidence Index™ Score: 8.4/10 | Confidence Level: Very High Confidence
Assessment: Transparent methodology, a probability-based national sample, and published margins of error support a high degree of confidence in the topline findings. Demographic weighting is disclosed and consistent with established survey science. Limits: The survey measures stated attitudes, not behavior, and should not be used to claim that expressed trust predicts specific future actions. Bottom Line: Strong source for describing public opinion at the time of fielding. Not sufficient on its own to support causal claims about why that opinion exists.
Source: Industry cybersecurity vendor, annual threat landscape report
W3 Evidence Index™ Score: 5.8/10 | Confidence Level: Limited Confidence
Assessment: The report aggregates real telemetry from the vendor’s own customer base and surfaces genuine industry signal, but methodology disclosure is thin, sample composition is not independently verifiable, and the vendor has a direct commercial interest in customers perceiving the threat environment as severe. Limits: Findings should not be read as representative of the broader threat landscape beyond the vendor’s customer footprint. Bottom Line: Useful for flagging emerging concerns worth independent investigation. Not strong enough to anchor a standalone risk claim.
Source: Viral social media post claiming a new policy change, no named source
W3 Evidence Index™ Score: 1.6/10 | Confidence Level: Very Low Confidence
Assessment: No identifiable origin, no methodology, and no independent corroboration at time of review. Engagement and reach are not evidence of accuracy. Limits: Cannot establish that the claimed event occurred or is accurately described. Bottom Line: Treat as an unverified signal worth checking against primary sources, not as evidence in itself.
Free Reader View — Score Only
Source: Pew Research Center, national survey on public trust in institutions
W3 Evidence Index™ Score: 8.4/10 | Confidence Level: Very High Confidence
Full grading scale and justification available to W3 members.
Source: Industry cybersecurity vendor, annual threat landscape report
W3 Evidence Index™ Score: 5.8/10 | Confidence Level: Limited Confidence
Full grading scale and justification available to W3 members.
Source: Viral social media post claiming a new policy change, no named source
W3 Evidence Index™ Score: 1.6/10 | Confidence Level: Very Low Confidence
Full grading scale and justification available to W3 members.
The asymmetry is deliberate. A score alone still tells a free reader something true and useful: roughly how much weight a source can bear. But the reasoning behind that number, the part that transfers as a skill rather than a single data point, is reserved for the members supporting the deeper research this work requires.
Conclusion
The modern information ecosystem rewards speed and certainty. It rarely rewards the slower work of asking whether a claim has actually earned the confidence it is given. The W3 Evidence Index™ is a bet that readers want that slower work done in the open, with a clear scale, an honest accounting of limits, and a standard that does not bend for sources that are popular, well-branded, or merely convenient.
Better sources. Better context. Better thinking. That is the standard the Evidence Index™ is built to hold.
References
Pew Research Center. (2024). Public trust in institutions: National survey methodology and findings. Pew Research Center.
W3 Magazine. (2026, June 2). Introducing the W3 Evidence Index™.
Music attribution: WJDZM5YFOEXOVQWD, TDXQTDZ2J7ADLEQW
Should I keep the audio? Background music? Comments about this article? Leave them below!